
1. Demographic Report
The demographic report, by default, only shows regional information. To show additional information such as the age and gender, you have to turn on Google Signal
Overview


Details
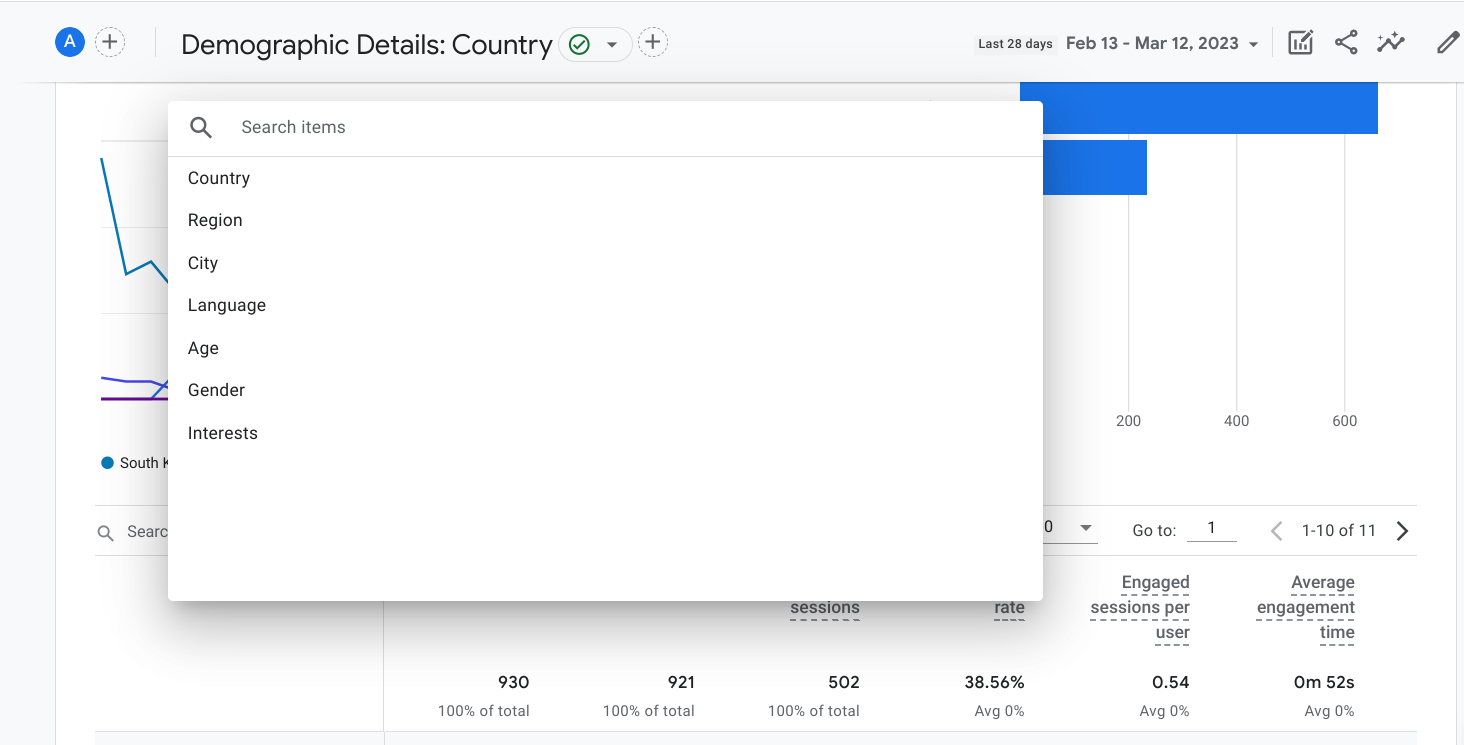
Provides a more detailed information by dimentions

You can choose one of the dimensions below (or add customized dimensions)
Default metrics are as follows:
▶ User (Auto)
The total number of active users
▶ New User (Auto)
The number of users who interacted with your site or launched your app for the first time (event triggered: first_open)
▶ Engaged Sessions (Auto)
The number of sessions that lasted:
- longer than 10 seconds
- or had a conversion event
- or had 2 or more screen or page views
▶ Engagement Rate (Auto)
The percentage of engaged sessions (Engaged sessions divided by Sessions)
▶ Engaged Sessions Per User (Auto)
Number of engaged sessions per user (Engaged sessions / Users)
▶ Average Engagement Time (Auto)
The average length of time that the app was in the foreground, or the web site had focus in the browser
▶ Event Count (Auto)
The number of times your users triggered an event
▶ Conversions (Events marked as a conversion)
Sum of revenue from purchases, subscriptions, and advertising
▶ Total Revenue (Populated when 'purchase' event comes in)
Sum of revenue from purchases, subscriptions, and advertising
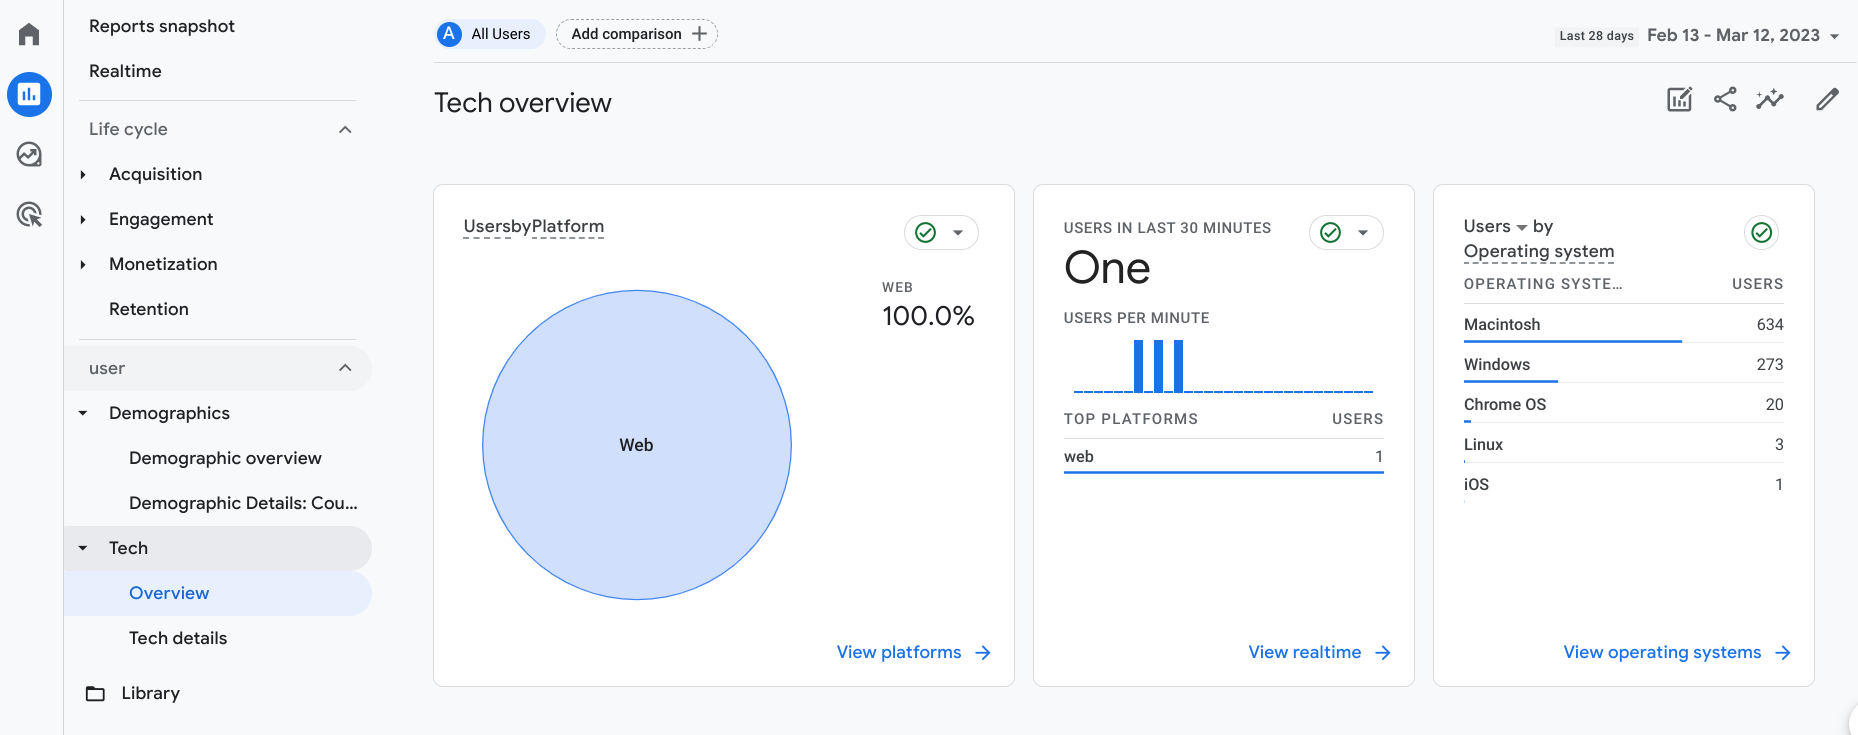
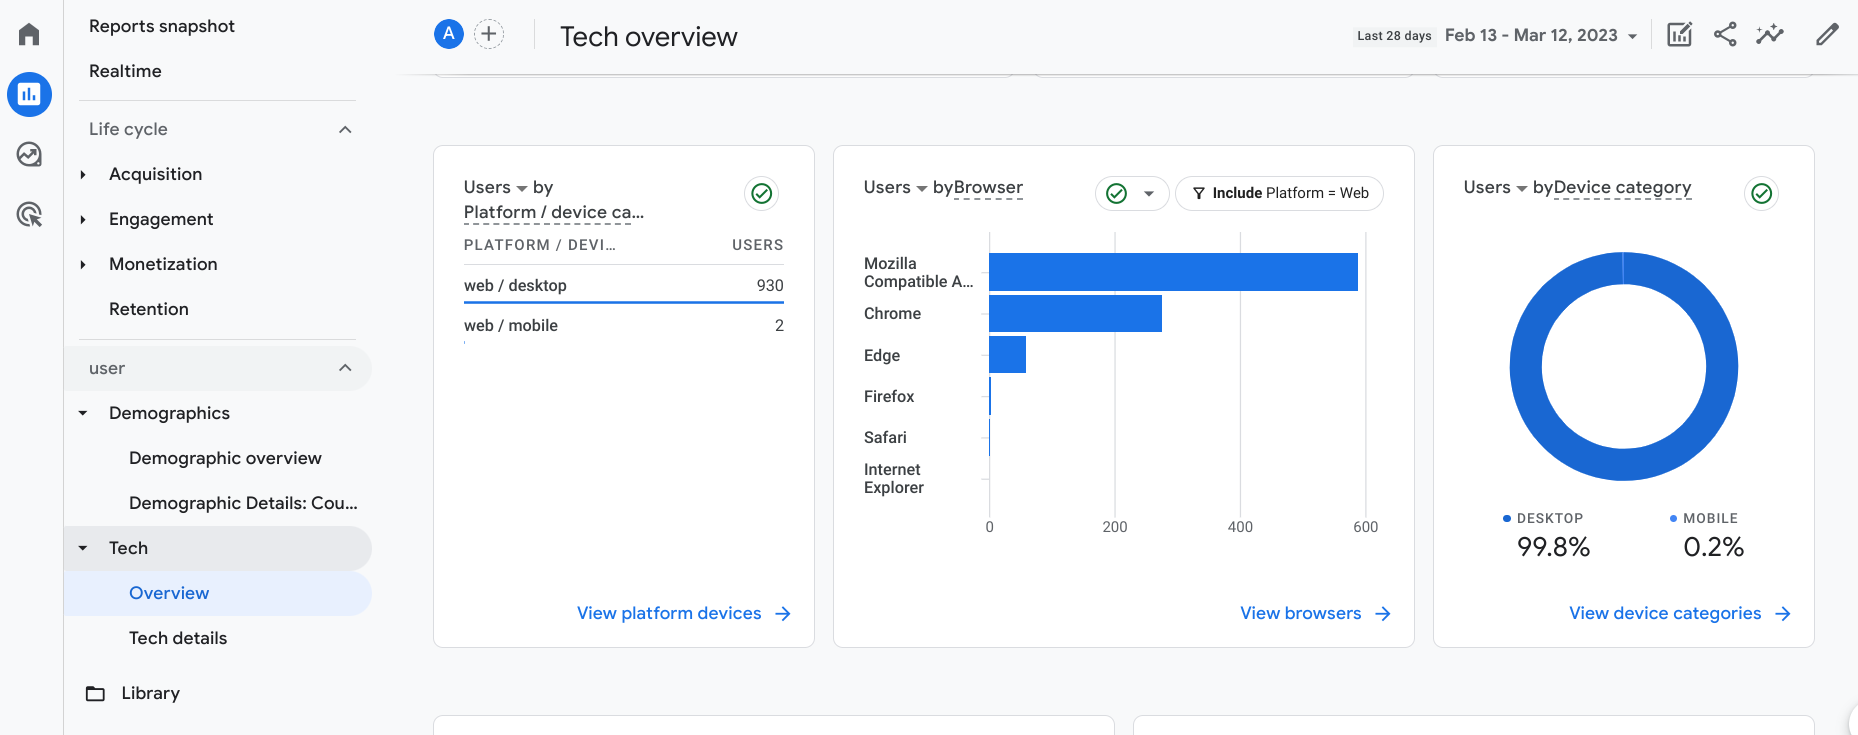
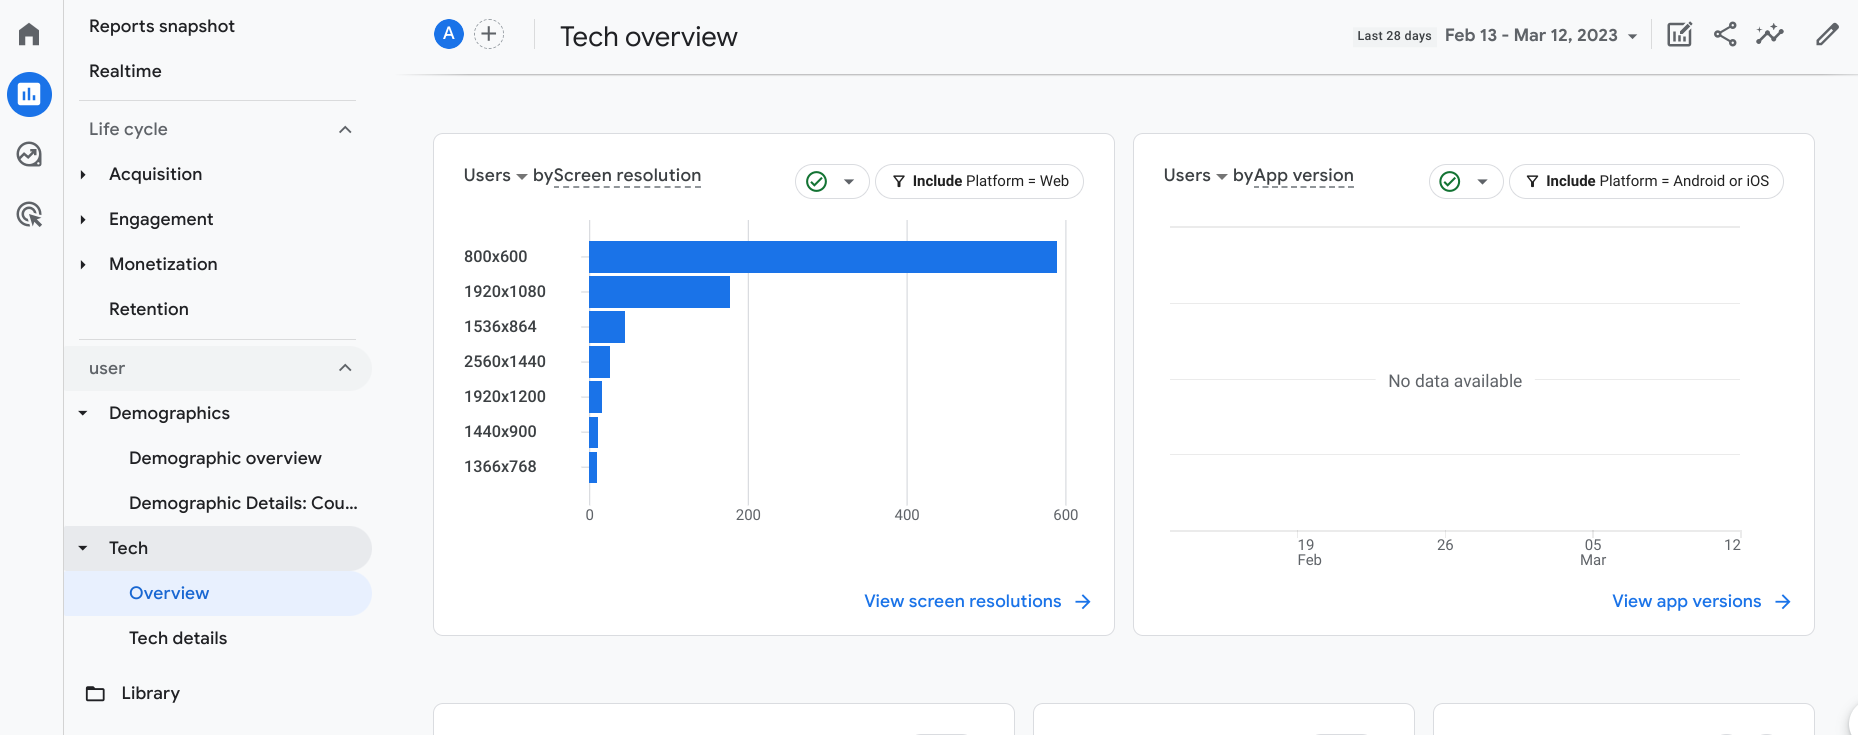
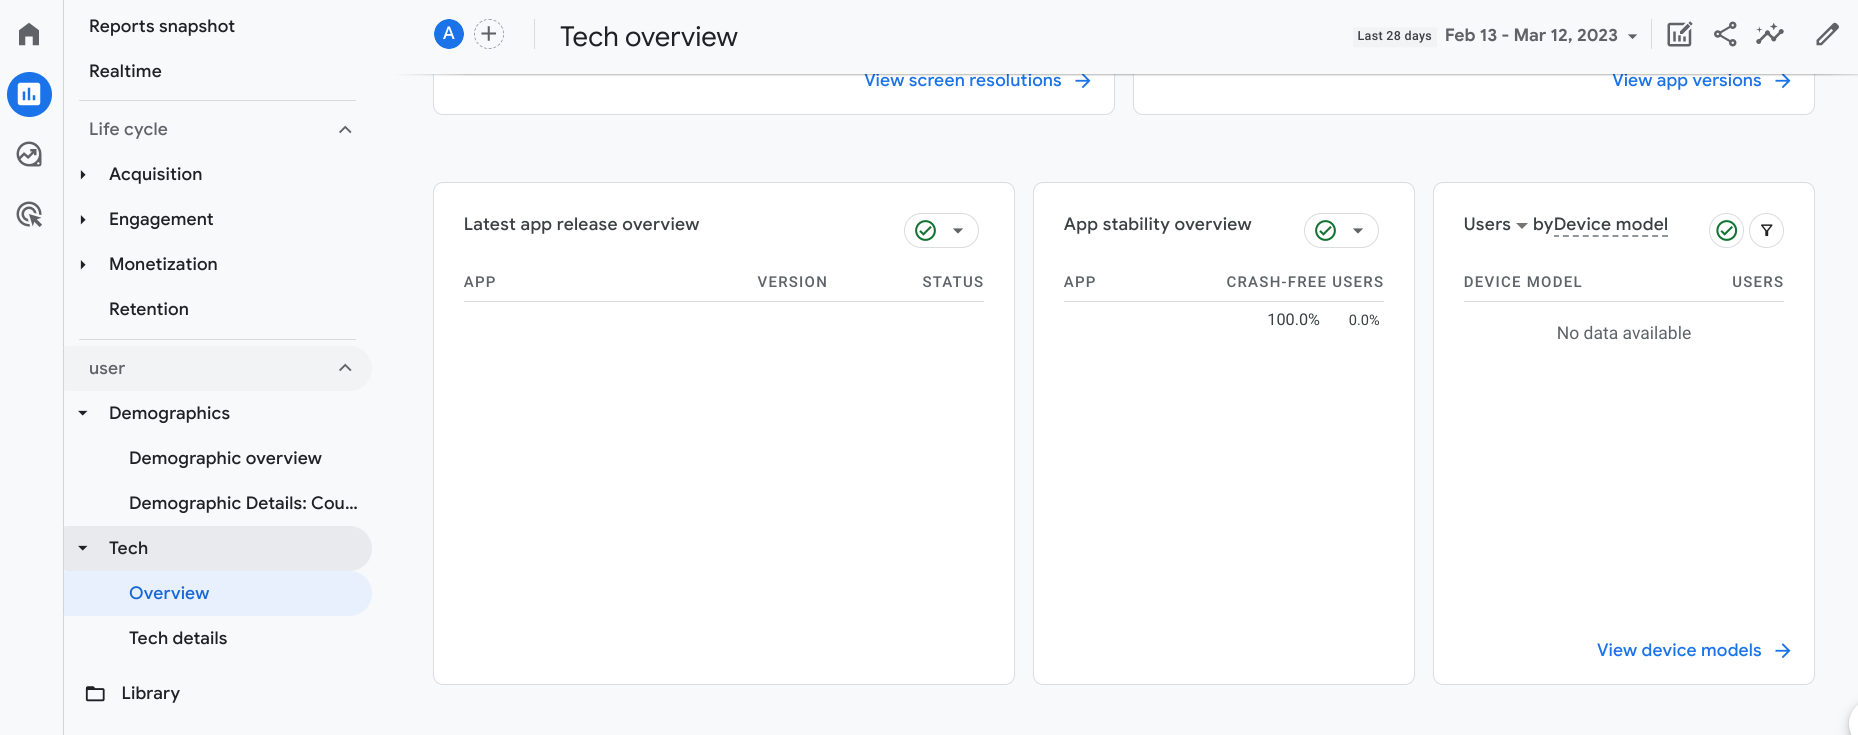
2. Tech
This reports the OS, device,... that users used when accessed to your site.
Overview
Details
Provides a more detailed information by dimentions
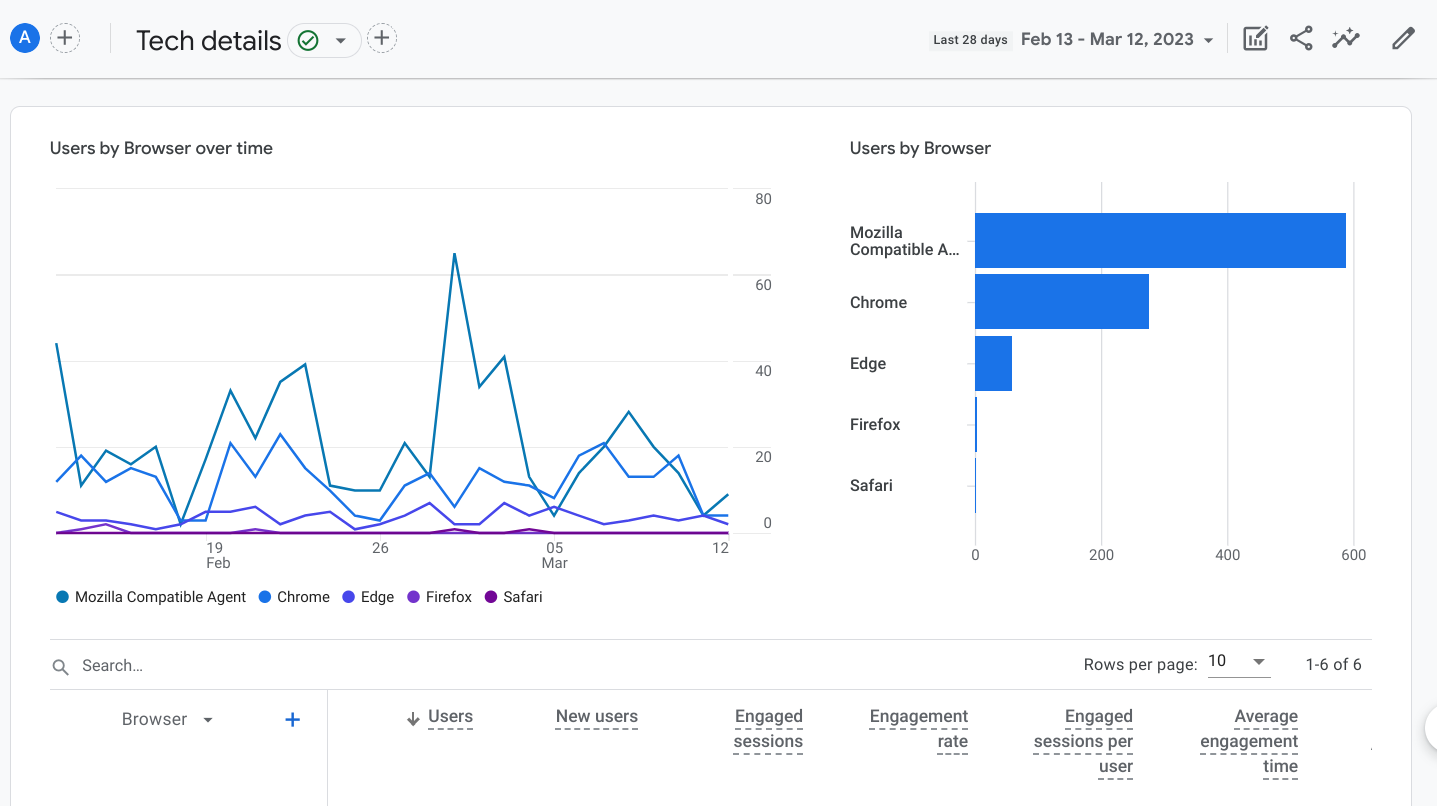
You can choose one of the dimensions below (or add customized dimensions)
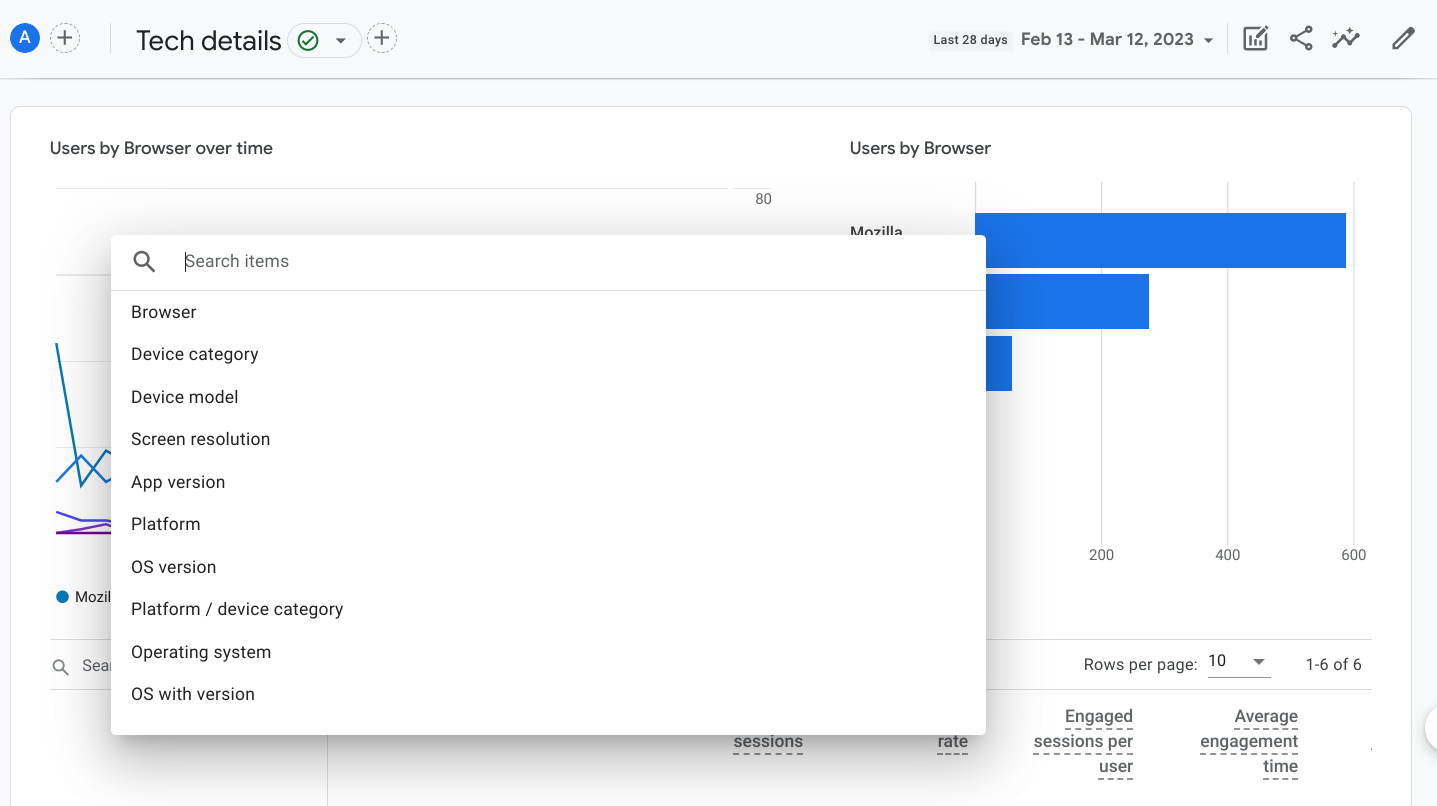
Default metrics are as follows:
▶ User (Auto)
The total number of active users
▶ New User (Auto)
The number of users who interacted with your site or launched your app for the first time (event triggered: first_open)
▶ Engaged Sessions (Auto)
The number of sessions that lasted:
- longer than 10 seconds
- or had a conversion event
- or had 2 or more screen or page views
▶ Engagement Rate (Auto)
The percentage of engaged sessions (Engaged sessions divided by Sessions)
▶ Engaged Sessions Per User (Auto)
Number of engaged sessions per user (Engaged sessions / Users)
▶ Average Engagement Time (Auto)
The average length of time that the app was in the foreground, or the web site had focus in the browser
▶ Event Count (Auto)
The number of times your users triggered an event
▶ Conversions (Events marked as a conversion)
Sum of revenue from purchases, subscriptions, and advertising
▶ Total Revenue (Populated when 'purchase' event comes in)
Sum of revenue from purchases, subscriptions, and advertising
We have explored GA4 user report in this writing and hope this gives you a better understanding of the report.
'Marketing and SEO > Google Analytics' 카테고리의 다른 글
| Google Analytics Conversion, Goal Set Up (1) | 2023.03.23 |
|---|---|
| GA4 - Session (2) | 2023.03.13 |
| GA4 - Report (Acquisition) (0) | 2023.03.13 |
| Google Signal (0) | 2023.03.10 |
| Analytics Dimensions and Metrics (1) | 2023.03.10 |


